|
||||||||||||||||||||||||||||||||||||||||||||||||||||||||||||||||||||||||||||||||||||||||||||||||||||||||||||||||||||||||||||||||||||||||||||||||||||||||||||||||||||||||||||||||||||||||||||||||||||||||||||||||||||||||||||
| Construction |
||||||||||||||||||||||||||||||||||||||||||||||||||||||||||||||||||||||||||||||||||||||||||||||||||||||||||||||||||||||||||||||||||||||||||||||||||||||||||||||||||||||||||||||||||||||||||||||||||||||||||||||||||||||||||||
Key Points
|
||||||||||||||||||||||||||||||||||||||||||||||||||||||||||||||||||||||||||||||||||||||||||||||||||||||||||||||||||||||||||||||||||||||||||||||||||||||||||||||||||||||||||||||||||||||||||||||||||||||||||||||||||||||||||||
Work Put in Place Canterbury has recorded strong growth in the value of commercial construction for much of this decade. Annual growth rates were particularly high from 1994 to 1996 but slowed during 1997 (Table 3.3).
The majority of new business floor space in Christchurch was built in suburban industrial zones. A variety of projects, such as the multistorey Bridgewater Apartments on Cashel Street and the Rebel Sports development on the corner of Colombo Street and Moorhouse Avenue, also contributed just over 14,000 square metres of new floor space to the Central City (Table 3.4a and 3.4b) .
One of the most significant building projects planned for Christchurch is the Ngai Tahu development of the substantial King Edward Barracks site on the western fringe of the CBD, adjacent to the Bridge of Remembrance. A 10-level tower and four three-level buildings, comprising a total area of 16,000 square metres of office space and 250 car parks are proposed (7) . Vacant Commercial Floor Space Much of the pool of inner city office floor space, which resulted from the mid-1980’s building boom, is now being utilised. The 1997 Fright Aubrey Investment Review indicated that the level of vacancies in the central business district of Christchurch had decreased dramatically in recent years. The survey found the overall vacancy rate stood at 19.1 percent, a substantial reduction from the 26 percent recorded in 1994 and 31 percent in 1993. The reduction in vacant office space this decade has been aided by conversion projects which have seen office blocks transformed to hotels and, to a lesser extent, apartments. At August 1997 Christchurch’s CBD had a total office space stock of 400,000 square metres, 76,400 squares metres of which were vacant.
The value of residential construction in Canterbury has also grown since 1992, although rates of growth appear somewhat erratic. After a drop in 1996, the value of work put in place rose in the year to June 1997 (Table 3.5).
Christchurch, which forms the largest urban centre in the region, is still experiencing high levels of residential construction. There were 2013 residential building consents issued for the year ended June 1997, down only slightly from 2086 in the year to June 1996 (see Figure 2.22 in the Built Environment Section). Preference for the construction of units or townhouses as opposed to dwellings continued over the last year with 1392 consents issued for units compared with 621 consents for dwellings. Overall, around 70 percent of new residential construction has been in the form of units since 1991. The preference for new units rather than single dwellings has been particularly pronounced in the inner city suburbs. High growth in residential construction has been supported by the expansion of the City’s population discussed earlier. This underlying upward pressure on demand can be expected to encourage residential building activity in 1998.
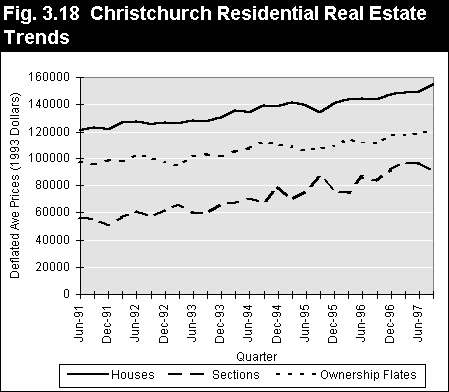
The real price of the average residential house in Christchurch increased from $121,346 in June 1991 to $149,944 in June 1997 (December 1993 dollars). This represents a 23 percent increase in the average price of a house in the City during this period. An increase has been observed in the average price of ownership flats. The average real price of an ownership flat increased from $97,702 in June 1991 to $119,243 in June 1997, a 22 percent increase. Section prices have also increased markedly this decade. During the period June 1991 to June 1997 the average section price increased from $56,148 to $95,973, an increase of 71 percent in real terms (Figure 3.18). This increase is in line with other major centres, particularly Auckland.
|
||||||||||||||||||||||||||||||||||||||||||||||||||||||||||||||||||||||||||||||||||||||||||||||||||||||||||||||||||||||||||||||||||||||||||||||||||||||||||||||||||||||||||||||||||||||||||||||||||||||||||||||||||||||||||||