|
|||||||||||||||||||||||||||||||||||||||||||||||||||||||||||||||||||||||||||||||||||||||||||||||||||||||||||||||||||||||||||||||||||||||||||||||||||||||||||||||||||||||||||||||||||||||||||||||||||||||||||||||||||||||||||||||||||||||||||||||||||||||||||||||||||||||||||||||||||||||||||||||||||||||||||||||||||||||||||||||||||||||||||||||||
| Profile of Christchurch Residents |
|||||||||||||||||||||||||||||||||||||||||||||||||||||||||||||||||||||||||||||||||||||||||||||||||||||||||||||||||||||||||||||||||||||||||||||||||||||||||||||||||||||||||||||||||||||||||||||||||||||||||||||||||||||||||||||||||||||||||||||||||||||||||||||||||||||||||||||||||||||||||||||||||||||||||||||||||||||||||||||||||||||||||||||||||
Key Points
|
|||||||||||||||||||||||||||||||||||||||||||||||||||||||||||||||||||||||||||||||||||||||||||||||||||||||||||||||||||||||||||||||||||||||||||||||||||||||||||||||||||||||||||||||||||||||||||||||||||||||||||||||||||||||||||||||||||||||||||||||||||||||||||||||||||||||||||||||||||||||||||||||||||||||||||||||||||||||||||||||||||||||||||||||||
The following section provides a profile of the people who normally live in Christchurch City and also illustrates how the City’s population has changed in recent years. The commentary and statistics cover a wide range of topics including shifts in the age structure, ethnic diversity, changes in family type and household size, labour force participation, income and income maintenance. A brief overview of Christchurch City Council’s Social Monitoring programme is also provided. This includes details of an internet site where more information about the programme is available. Data used in the following section has been obtained from Statistics New Zealand’s 1996 Census of Population and Dwellings. Comparative information from previous censuses and population projections have also been incorporated where appropriate. More detailed tables are included in Appendix Two.
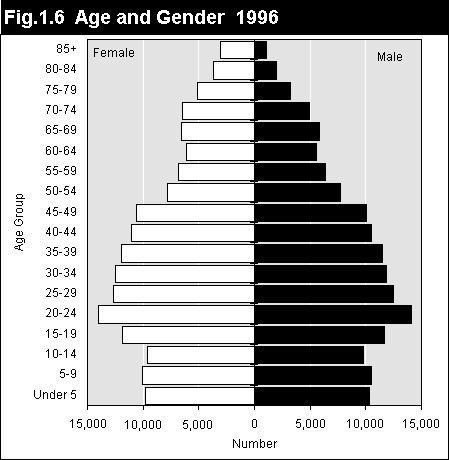
In line with national statistics, more females than males live in Christchurch. In 1996 females outnumbered males by about 10,000 (159,393 females and 149,643 males). Females and male comprise 52 percent and 48 percent of residents respectively (Appendix 2: Table 1). Females outnumber males because of differences in mortality at various ages and greater longevity amongst women. Although generally more boys than girls are born in any year, males normally experience a higher death rate than females at most ages and this gradually erodes their numerical advantage (9). Figure 1.6 shows that, in Christchurch during 1996, males outnumbered females in the very early age groups. However, after the childhood years, the number of females in each age group is generally higher. This disparity becomes particularly pronounced in the later age groups where nearly 62 percent of residents older than 70 are female.
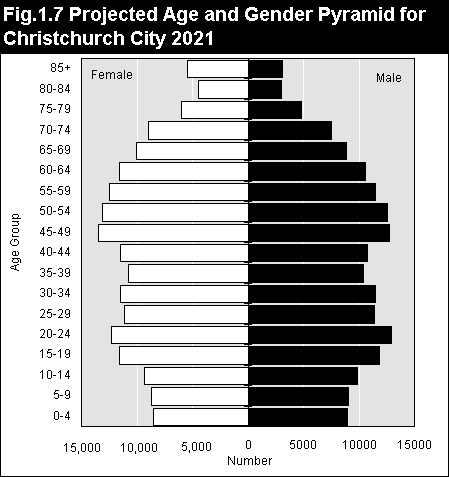
Age and gender projections suggest that although men can be expected to make up an increasing proportion of the elderly, it is likely that elderly women will still greatly outnumber elderly men in the foreseeable future (Figure 1.7).
The age structure of Christchurch’s population has undergone major changes in recent decades. In line with national trends the City’s population is progressively ageing. Table 1.9 provides a series of indices which demonstrate this phenomenon. The median age, or the point at which half the population is older, is a particularly useful summary of change. Table 1.9 shows that the City’s median age has increased substantially from 27.9 years in 1976 to nearly 34 years in 1996. Over the next few decades the median age is expected to increase further to 41.4 years.
Table 1.9 also highlights a general reduction in the proportion of people aged 0-14 years (children) (10) and an increase in the proportion and number of people aged 65 years and over. This is a result of lower fertility, the passage of the large baby boom generation up the age scale (those born between 1946 and 1965), and increases in life expectancy. Long term, both the number and proportion of children is expected to shrink while the City’s elderly population will continue to swell. The increasing number of elderly will become particularly pronounced when the baby boomers start to reach retirement age at about 2011.
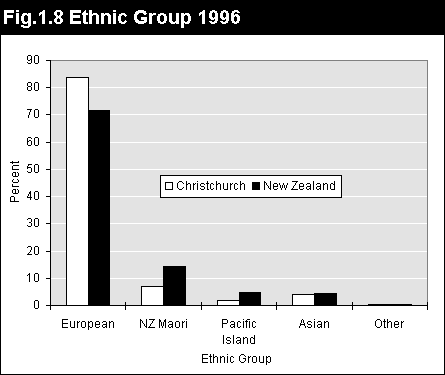
European Christchurch’s European ethnic group is large and also very diverse. It includes people who have migrated to New Zealand from countries such as England, Ireland, Scotland, Wales, Australia and other European countries. It also comprises residents who were born in New Zealand and are descendants of European settlers and migrants. Although Christchurch’s population is gradually becoming more ethnically diverse, proportionately significantly more residents identify with the European ethnic group in the City than in New Zealand as a whole. In 1996, 83.6 percent of residents (258,378) in Christchurch City were European compared with 71.7 percent nationally (Figure 1.8 and Appendix 2: Table 2).
Maori In 1996 there were 21,462 Christchurch residents who identified with the Maori ethnic group. This group was the second largest in Christchurch, comprising 6.9 percent of residents. Nationally, 14.5 percent of residents were Maori (Figure 1.8 and Appendix 2: Table 2). Pacific Island Christchurch has a small Pacific Island community which has grown marginally since 1991. In 1996 the Pacific Island ethnic group comprised 1.9 percent of the population (5979 people) compared with 1.7 percent in 1991. Nationally, nearly five percent of the population were Pacific Islanders in 1996 (Figure 1.8 and Appendix 2: Table 2). Asian Christchurch has a growing Asian community. Numbers have been boosted by a significant increase in migration this decade resulting from shifts in immigration policy. In 1996 Asians comprised 4.1 percent of residents (12,600 people), up from 2.0 percent (5934 people) in 1991. New Zealand wide, the Asian ethnic group comprised 4.4 percent of the population in 1996 (Figure 1.8 and Appendix 2: Table 2).
In 1996 the vast majority of Christchurch residents (251,115 people or 81.2 percent) were born in New Zealand. Nationally, 78.7 percent of the resident population was New Zealand born. Of the 57,915 Christchurch residents born overseas at the time of the last census, 30 percent had lived in New Zealand under 10 years and 21 percent for less than five years. Those born in the United Kingdom made up the largest overseas-born group. This was followed by people born in Asia, Europe, Australia and the Pacific Islands. There was also a large group of residents who did not specify a country of birth at the last census (Table 1.10).
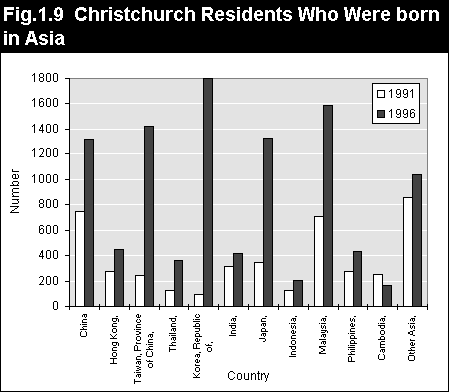
Between 1991 and 1996 there were some notable changes to the number of foreign-born residents in Christchurch and their birthplace distribution, reflecting changes in immigration policy this decade. Overall, the number of overseas-born residents increased by over 15,500 during the five years to 1996. They included more residents born in Weatern Samoa, Australia, the United States of America and Canada. There was also a substantial increase in the number of residents indicating one of several Asian countries as their place of birth. The number of those born in Korea, for example, grew from 96 to 18,000. A similar trend can be seen among those who stated their birthplace as Taiwan and Malaysia (Figure 1.9). In contrast to the growth of Asian-born residents in Christchurch, New Zealand’s traditional migrant source, the United Kingdom, recorded a decrease as a birthplace in 1996. However, it still remains the largest group overall (Appendix 2: Table 3).
Most Christchurch residents (298,500 people) live in private dwellings. City-wide there were 116,166 private dwelling in 1996 and 453 non private dwellings such as rest homes, hospitals and prisons. Christchurch residents live in a variety of different types of private dwellings and do so for reasons such as family circumstances, financial necessity, and because of location and lifestyle preferences. In 1996 the most popular type of home was the conventional detached house (75.4 percent of private dwellings (11) ) followed by two houses or flats joined together (24 percent). In contrast less than 1 percent of dwellings were baches, huts or temporary premises intended for short-term accommodation (Appendix 2: Table 4 also see Table 2.19 in the Built Environment Section).
Privately-owned homes (with and without a mortgage) still vastly outnumber those that are rented. However, in recent years, home ownership in the City has declined while the amount of rental accommodation has grown proportionately. In 1996 just under 70 percent of dwellings were owned compared with 74 percent in 1991. In contrast, around 25.4 percent of private dwellings in the City were rented in 1996, up from 22.8 percent in 1991. Rental accommodation in Christchurch is provided by private individuals and a number of organisations including Housing New Zealand, real estate agencies and the Christchurch City Council. Since 1991 there has been a marked increase in the amount of privately provided rental accommodation in the City. In 1996, 17,919 rental properties were provided privately compared with 12,069 in 1991. Conversely, the amount of rental accommodation provided by a variety of other organisations has decreased (Appendix 2: Table 5). For those who rent in Christchurch the average weekly rent paid for permanent private dwellings in 1996 was $155.22, compared with $160.93 for New Zealand as a whole.
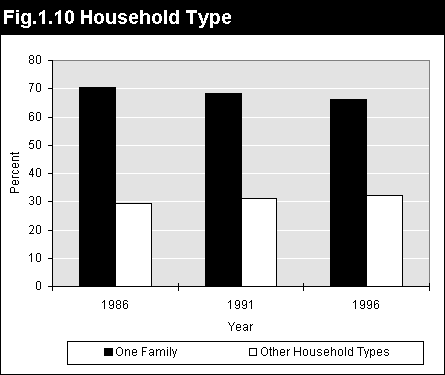
The majority of households in the City are one family households (12) . Although this type of household has grown numerically in recent years, proportionately it has actually decreased. In contrast, there has been a small percentage increase in some other household types - one family plus other, multiple family and single person households (Figure 1.10 and Appendix 2: Table 6).
The proportional decline in one family households and growth in other household types in Christchurch is similar to New Zealand as a whole and reflects a variety of demographic and social changes. These include:
The ‘type’ of households in Christchurch is not only changing but households are also getting smaller. In 1976 the average household occupancy rate for the City was 3.1 people. This declined to 2.8 by 1986 and reached an all time low of 2.6 in 1996. This trend is expected to continue in the future, placing additional pressure on existing housing and residential land stocks and associated services. The average size of households is decreasing because the rate of household formation is exceeding the rate of population growth. Factors which have contributed to the accelerating rate of household formation in recent years include:
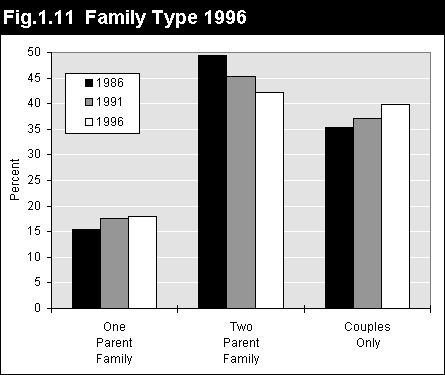
Family Type There have been big changes in the make-up of Christchurch families over the last decade. The once typical family, comprising two parents with at least one dependent child, now accounts for a smaller share of total families than it did ten years ago. In 1986 two parent families comprised 49.4 percent of families. This declined to 42.2 percent in 1996. The decline in the two parent family has been offset by an increase in one parent families and couples without children. During the 10 years to 1996, one parent families increased from 15.3 to 18 percent while couples without children grew from 35.3 to 39.8 percent (Figure 1.11 and Appendix 2: Table 7).
The increase in divorce and separation and falling marriage rates as couples delay or avoid formal marriage ties have been major contributors to the growing number of one parent families in recent years. Growth in the number of couples without children (14) reflects two main trends: the general ageing of the population, which has shifted large numbers of people into the age groups where life without children is likely, and the postponement of childbearing by young couples (15) . Dependent Children Families In line with national trends, the traditional two-child family has been overtaken by the one-child family as the most common type in Christchurch (Appendix 2: Table 8). At the latest census, around 20 percent of all families with children (including adult and dependent) contained three or more children, 37.2 percent had two children, while nearly 42.6 percent contained just one. Most of the focus on families centres around those which contain dependent children. The 1996 census defines a ‘dependent’ child as one who is under 18 years old and not in full-time employment (that is, still at school, in tertiary training, unemployed or working less than 30 hours per week). Of those families with dependent children only, 19 percent had three or more children, 39 percent comprised two children and 42 percent comprised one child.
The City’s labour force has grown considerably since 1991 and now comprises 154,788 people. During this period full and part-time employment increased numerically while unemployment declined (Table 1.11).
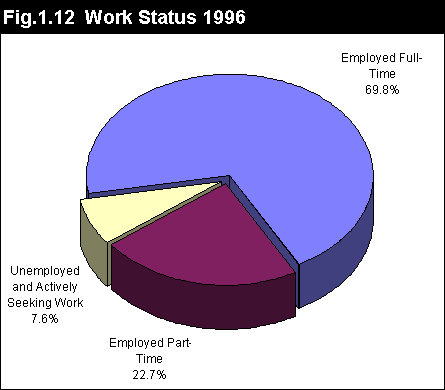
Latest figures dramatically contrast to those of the previous five years from 1986 to 1991, when the labour force actually contracted. This was largely in response to the 1987 share market crash and the restructuring of the New Zealand economy. In 1996, 69.8 percent of people in Christchurch’s labour force were employed full time, 22.7 percent were employed on a part-time basis and 7.6 percent were unemployed (Figure 1.12) (17) . These figures were similar to those recorded nationally (Appendix 2: Table 9).
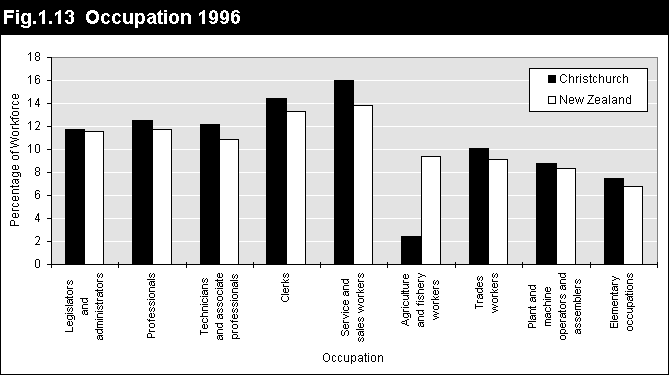
Participation in full-time and part-time work varies in relation to gender. Males accounted for 62 percent of people working full-time (18) in 1996 while females dominated the part-time category comprising 71.3 percent of part-time workers. (19) Another major employment trend has been the growth of part-time employment. While the majority of workers still work full time, the level of part-time employment has increased steadily. In 1996 part-time workers comprised 23 percent of the labour force compared with 17 percent in 1991. Part-time employment has been boosted by large numbers of women combining unpaid work at home with paid employment and also increasing numbers of young people combining study with part-time jobs. In addition to residents who were either working or looking for employment, just over 89,600 people aged 15 years and over were not involved in regular paid work. According to the census, many of these residents were involved in a variety of other activities both for their own household and other households including housework, gardening and caring for others. Occupation Christchurch residents were involved in a diverse range of occupations. In line with national trends, service and sales was the largest occupational group in Christchurch, accounting for 16 percent of residents aged 15 years and over in 1996. This group was followed by clerks (14.5 percent) and people engaged in professional occupations (12.5 percent). In contrast, the proportion of agricultural and fishery workers was considerably less in the City than in the whole country (Figure 1.13 and Appendix 2: Table 10).
Incomes Sources and Incomes (20) Income Sources Although few people in Christchurch have no income at all, there is considerable variation in the sources of income and the amount individuals receive. In 1996 wage and salaries was the most common source of income for Christchurch residents. In the 12 months before the last census, nearly 57 percent of residents aged 15 years and over received income from wages and salaries. Government-funded benefits are also a major income source. Of Christchurch residents aged 15 years and over 94,719 said that they had received one or more government benefits during the 12 months to March 1996. This translates to 38 percent of the 15 plus population. New Zealand superannuation made up the largest number of payments, followed by the unemployment benefit. (Table 1.13, Appendix 2: Table 11).
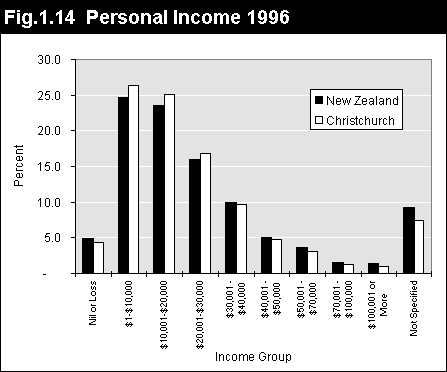
Sources of income varied markedly with gender. More males received income from wage and salaries and from self employment in 1996, reflecting their higher rates of participation in the paid labour force. More females received income from government benefits. Personal Income Seventy three percent of all Christchurch residents aged 15 years and over indicated they had a personal income of less than $30,000 in 1996. At the other end of the scale only 2 percent of residents received an annual income of more than $70,000 (Figure 1.14, Appendix 2: Table 12).
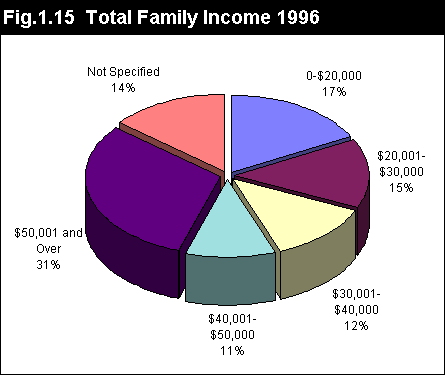
The income distribution of residents who worked full and part time showed a somewhat different picture. Just under 55 percent of people who worked full time (30 hours or more) had an annual gross income of $30,000 or less, while 6.2 percent received $70,000 or more. The majority of part-time workers (79.5 percent), who worked less than 30 hours per week, had incomes under $20,000. Family Income Family income is the income of couples and people with children. Thirty two percent of families in Christchurch received a before tax income of $30,000 or less for the 12 months to March 1996, while 31 percent of families had an annual income of over $50,000 (Figure 1.15 and Appendix 2: Table 13). The median income for Christchurch families was $38,947 compared with $39,205 nationally.
Monitoring Poverty, Hardship and Community Well-Being in Christchurch The Christchurch City Council has developed a social monitoring programme which aims:
A web site currently provides a range of information relating to the Social Monitoring programme. This includes an overview of the programme and the methodology used, a summary of main findings, details of reports produced, longer term goals of the programme and references to related work. This can be accessed as follows: http://www.ccc.govt.nz//SocialMonitoring A report entitled Christchurch City Council, Poverty and Hardship in Christchurch, Findings from Target Week Survey Data, which summarises the programme’s latest results, has also been produced. For further information about the Christchurch City Council’s Social Monitoring Programme, please contact the Co-ordinator, Kath Jamieson, Community Adviser - Research, at the Christchurch City Council, PO Box 237, Christchurch, phone 941 8885, fax 941 8267 or E-mail (Jamiesonk@ccc.govt.nz) Jamiesonk@ccc.govt.nz.
|
|||||||||||||||||||||||||||||||||||||||||||||||||||||||||||||||||||||||||||||||||||||||||||||||||||||||||||||||||||||||||||||||||||||||||||||||||||||||||||||||||||||||||||||||||||||||||||||||||||||||||||||||||||||||||||||||||||||||||||||||||||||||||||||||||||||||||||||||||||||||||||||||||||||||||||||||||||||||||||||||||||||||||||||||||