
This page is not a current Christchurch City Council document. Please read our disclaimer.

The Primary Sector[6]
There is only limited economic activity in the agricultural, hunting, forestry and fishing industries within Christchurch City. It is estimated that primary production in the Christchurch area represents less than 2 percent of national activity for these industries. Only 809 people were estimated to work in the sector in February 1996, with 238 of these being in part-time employment. Despite the limited level of activity it would be incorrect to conclude the sector is unimportant for the economy of the City. Substantial primary production is undertaken in the wider Canterbury region representing approximately 12 percent of national agricultural activity and about 10 percent of total primary production. This production has significant flow on effects for economic activity within the City.
Despite recent increases in activity in other primary industries, agriculture remains the mainstay of primary production in Canterbury representing over 80 percent of primary sector GRP. Animal husbandry and arable farming remain the predominant form of farming in the area. This activity is now being complemented by a small but increasing level of horticultural production. Much of this production is destined for export markets. The agricultural industry alone is estimated to provide nearly 90 percent of Canterbury’s export income.
With some exceptions, the medium term outlook for the primary sector is considered positive. Concern remains regarding some short term commodity prices (particularly for beef and to a lessor extent sheep meats) but this is balanced by the positive outlook for groups such as dairying. The sector is expected to be boosted by the flow on effects of the GATT Uruguay Round and subsequent changes in agricultural subsidies and trade policies in the European Union and the United States. The expected growth in the economies of our major trading partners, particularly in Asia, is also expected to increase demand for New Zealand’s primary products.
The Secondary Sector
The secondary sector is comprised of the manufacturing industries, utilities such as electricity, gas and water, and construction. Over the four years to March 1996 the sector is estimated to have grown by 24 percent. However, in the year to March 1996 secondary production is estimated to have increased by only 1.8 percent down sharply from the 9.4 percent recorded in the March 1995 year. The sector produces over a quarter (28 percent) of Christchurch’s total economic output and employs just under 30 percent of the local work force.
Despite the record of substantial growth over the last four years the sector has been effected by the general economic slowdown recorded over the last 12 to 18 months. Since early 1995 the combined impact of higher interest rates and rapidly increasing exchange rates has effectively stalled expansion in large areas of the sector.
Manufacturing
Until late 1994 the Canterbury Manufacturers’ Association survey was identifying strong domestic demand supporting high levels of export sales. This growth was accompanied by an increase in employment and expectations of further expansion (Figure 3.15).
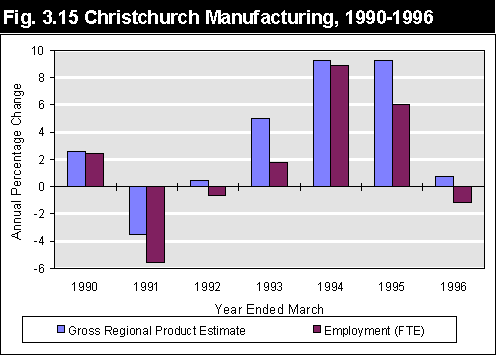
Source: Statistics New Zealand; GRP Estimate - Christchurch City Council
This picture changed sharply in early 1995 resulting in a sharp downturn in the rate of GRP growth. In the year to March 1996 the sector grew by only 0.7 percent compared to 9.3 percent for the year to March 1995. The combination of high interest and exchange rates (particularly in relation to the Australian and US dollars) impacted directly on the profitability of manufacturers. Business confidence in the sector fell sharply and little growth was recorded in domestic sales. This downturn has resulted in firms cutting jobs rather than expanding employment over the last year. Job losses have been particularly heavy in the apparel and textile industries.
Despite the deterioration in trading conditions experienced by manufacturers over the last 18 months, medium to long term prospects appear good. Short term interest rates are beginning to ease although there has been continuing upward pressure on exchange rates in recent months. The temporary respite from the high Australian dollar which manufacturer’s welcomed in the first half of 1996 appears to have passed with the rate again moving upwards. It is now being suggested that the Reserve Bank has accepted that interest rates may have to remain at levels below and exchange rates above the Bank’s targets due to the pressure placed on the economy by international investors keen to benefit from New Zealand’s very high real interest rate margins.
However, the international competitiveness of local manufacturers means they are well placed to take advantage of expected growth in the economies of our trading partners. Domestic sales should also be boosted by higher household disposable incomes resulting from the expected tax cuts and lower inflation. This increase in spending will continue to be supported by the strong population growth currently being experienced in the region.
Construction
Activity in both residential and commercial construction has expanded strongly in the past three years. Production is estimated to have increased by 38 percent since 1993 with employment increasing by a similar margin. In part, the scale of this recovery must be attributed to the depth of the recession in the industry in 1990/91 and 1991/92 (Figure 3.16). As with many other areas of the economy the rate of growth in the construction industry has moderated over the last financial year down to 7.2 percent for the year ended March 1996 compared to 14.6 percent for the 1994/95 March year. This is however a very strong level of growth given the sustained period of high real interest rates facing residents and commercial developers.
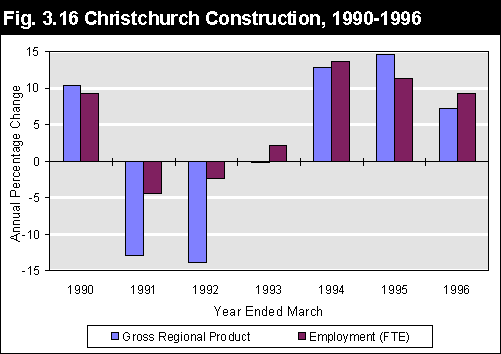
Source: Statistics New Zealand; GRP Estimate - Christchurch City Council
Commercial Construction
Canterbury has recorded very strong growth in the value of commercial construction during the last three years. In fact, the value of work put in place grew by nearly 50 percent in both the 1994 and 1995 March years and by a further third in the year to March 1996. (Table 3.3).
In addition, much of the pool of vacant commercial floorspace which resulted from the mid 1980’s building boom is now being utilised. The 1995 Fright Aubrey Investment Review[7] indicated that the level of vacancies in the central business district of Christchurch had decreased dramatically in recent years. The survey found the overall vacancy rate stood at 19 percent, a substantial reduction from the 26 percent recorded in 1994 and 31 percent in 1993. This reduction has been aided by a number of conversion projects which have seen office blocks transformed to hotels and to a lesser extent apartments. At March 1995 Christchurch’s CBD had a total stock of office space of 404,000 square metres, 76,000 squares metres of which were vacant.
| Table 3.4 Value of Work Put in Place* - Canterbury Statistical Area | ||||
Year Ended March |
Non-Residential $ million |
% change |
Total $ million |
% change |
| 1991 | 177.4 | - | 509.1 | - |
| 1992 | 121.2 | -32% | 453.8 | -11% |
| 1993 | 129.9 | 7% | 494.3 | 9% |
| 1994 | 192.7 | 48% | 590.9 | 20% |
| 1995 | 280.7 | 46% | 778.0 | 32% |
| 1996 | 365.4 | 30% | 839.2 | 8% |
| *includes alterations and additions | ||||
Source: Statistics New Zealand
In Christchurch, building consents were issued for 210,254 square metres of new floor space in business zones in the year ending June 1996. This is a 20 percent increase over the previous year when consents for 174,004 square metres of floor space were issued.
Developments which have gained consents during the past year include the completion of the redeveloped Northlands Mall, the redevelopment of Shirley Mall as well as other retail developments at the Bush Inn Centre, Richmond and Fendalton. Development of the Convention Centre, a major new apartment building, an apartment and hotel conversion and a new medical clinic in Oxford Street have contributed to a substantial increase in floor space in the Central City. There have also been a variety of industrial projects occurring in the City. The majority of this work has been in the South West of the City, in the Hornby, Islington and Wigram areas. There has also been considerable development in Bromley.
In 1995, commercial property consultants, Colliers Jardine believed prime city office space would remain in demand for at least the next four years. Colliers pointed out however that increases in rentals in Christchurch were not expected to be nearly as marked as those seen in Auckland or Wellington. There is a suggestion in the industry that Christchurch is unlikely to see the development of an additional prime office building until gross rentals exceed $300/m2. This has not been forecast to occur before the end of this decade.
A 1995 international survey of 164 world business districts found that Christchurch had the fourth cheapest business centre at $174.48/m2, closely followed by Wellington in fifth place at $180.62/m2 with Auckland being slightly dearer at $187.72/m2 in ninth place. Prospects for industrial sites are also considered favourable with a healthy demand for well situated properties.
Residential Construction
Residential construction in Canterbury has also grown strongly since 1992, although the value of work put in place has fallen slightly in the year to June 1996. (Table 3.4).
| Table 3.4 Value of Work Put in Place* - Canterbury Statistical Area | ||||||||
Year Ended March |
Residential $ million |
% change |
Total $ million |
% change |
||||
| 1991 | 331.7 | - | 509.1 | - | ||||
| 1992 | 332.6 | 0% | 453.8 | -11% | ||||
| 1993 | 364.4 | 10% | 494.3 | 9% | ||||
| 1994 | 398.2 | 9% | 590.9 | 20% | ||||
| 1995 | 497.3 | 25% | 778.0 | 32% | ||||
| 1996 | 473.8 | -5% | 839.2 | 8% | ||||
| *includes alterations and additions | ||||||||
Source: Statistics New Zealand
Christchurch, which forms the largest urban centre in the region, has also experienced a decline in residential activity over the last year. There were 2,086 residential building consents issued for the year ended June 1996 down from 2,532 in the year to June 1995 a fall of 18 percent. In part, this decline must be attributed to the unprecedented number of consents issued during 1994/95. This surge has been attributed to uncertainty prior to the notification of the proposed City Plan. This uncertainty may have resulted in a number of developers and home builders obtaining consents in advance of any possible City Plan rule changes.
There has continued to be a preference for the construction of units as opposed to dwellings over the last year. Over 70 percent of new residential construction has been in the form of units. The preference for new units rather than single dwellings has been particularly pronounced in the inner city suburbs.
The recent growth in residential construction has been supported by the expansion of the City’s population which has been discussed earlier in this report. This underlying upward pressure on demand combined with recent falls in interest rates and inflation can be expected to encourage residential building activity in 1997. This positive outlook will receive further support if the second round of tax cuts are introduced in 1997.
Residential Property Values
Recent trends in the cost of residential property in Christchurch reflect the combined affects of an increasing population, rapidly expanding economy, a period of lower inflation and to a lessor extent interest rates. The real price of the average residential house in Christchurch increased from $124,004 in June 1991 to $144,987 in June 1996 (December 1993 dollars). This represents a 17 percent increase in the average price of a home in the City over the past five years.
An increase has also been observed in the average price of ownership flats. The average real price of an ownership flat has increased from $96,906 in June 1991 to $112,960 in June 1996, a 17 percent increase over the period. Most of this increase occurred in the short period between June 1993 and June 1996.
Section prices have also increased markedly, particularly since December 1993. Over the period June 1991 to June 1996 the average section price increased from $55,173 to $84,619, an increase of 53 percent in real terms. This increase is in line with other major centres, particularly Auckland (Figure 3.17).
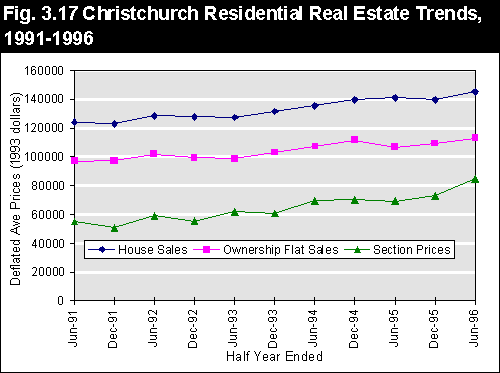
Source: Valuation New Zealand
In assessing the implications of the increase in the real cost of housing affordability, changes in the level of household income during the period must be taken into account. To fully assess this issue we will need to await income data from the 1996 Census of Population and Dwellings.