
This page is not a current Christchurch City Council document. Please read our disclaimer.

The Use of Ground Water
The groundwater resource beneath Christchurch is currently the sole source of drinkable water for the City’s inhabitants. It is relied on to continuously provide high quality water for which no treatment is required. Christchurch obtains its water supplies via groundwater bores ranging in depth from 25-180 m. Groundwater aquifers are recharged in the inland plains and later flow eastward towards the coast, finally discharging offshore.
Approximately 50 million cubic metres of water are drawn annually from the Christchurch - West Melton aquifer system by the City Council and pumped through the City’s reticulation system. This water is allocated approximately as follows:
It is estimated that around 20 percent of water is lost from the system through leakage. This figure compares reasonably well with typical figures world-wide of between 13 and 39 percent. The City Council is constantly working to reduce leaks in its reticulation network, as well as assisting private property owners to identify and remedy leaks.
The amount of water drawn by the Council by month since 1992/93 is shown in Table 2.8. Typically production is highest during the summer period.
| Table 2.8 Water Production by Month 1992-1996 (litres) | ||||
| Month | 1992/93 |
1993/94 |
1994/95 |
1995/96 |
| July | 3,671,687 |
3,537,196 |
3,688,000 |
3,212,287 |
| August | 3,857,874 |
3,903,221 |
3,772,000 |
3,225,185 |
| September | 4,013,034 |
3,390,438 |
4,016,000 |
3,473,258 |
| October | 4,539,117 |
5,521,109 |
4,164,000 |
3,584,908 |
| November | 5,057,428 |
5,139,725 |
5,327,000 |
4,466,369 |
| December | 4,810,959 |
4,066,535 |
5,316,000 |
5,947,071 |
| January | 5,599,348 |
4,679,647 |
5,794,000 |
5,570,126 |
| February | 4,687,380 |
5,257,563 |
4,360,000 |
5,114,601 |
| March | 4,668,640 |
4,005,353 |
4,423,000 |
3,981,323 |
| April | 3,828,927 |
4,328,751 |
3,442,000 |
3,468,918 |
| May | 3,845,828 |
3,487,794 |
3,254,000 |
3,286,882 |
| June | 3,480,899 |
3,304,974 |
3,096,000 |
3,020,668 |
| Total | 52,061,121 |
50,622,306 |
50,652,000 |
48,351,596 |
Source: Christchurch City Council
The difference between summer and winter aquifer levels has increased significantly over the years. However abstraction currently appears to be within sustainable levels, with full recharge occurring over the winter months.
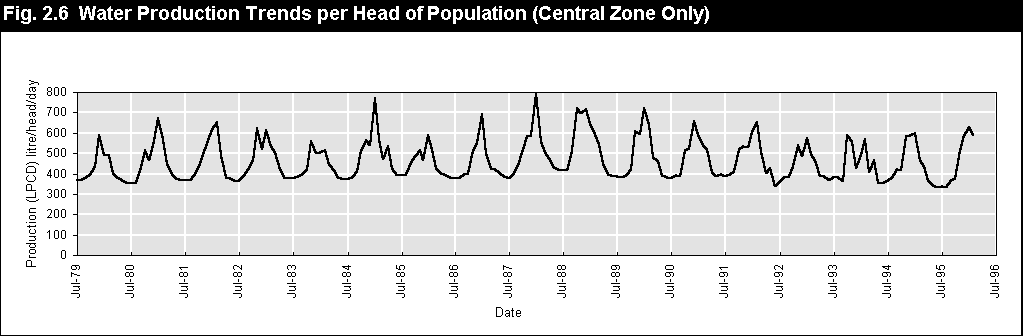
Variations in water demand over the past twenty years have been due to climatic conditions and growth in both population and commercial demand. The City’s water demand per head of population has been fairly constant in the past and is expected to continue at or near existing usage (Figure 2.6)
The abstraction required for the municipal supply is therefore likely to increase at the same rate as the population, although the following may reduce demand:
• An effective pricing policy for water has the potential to reduce residential water demand by approximately 25 percent.
• A proactive leak detection programme has been initiated and has the potential to reduce abstraction by up to 7 percent approximately.
• A continuing programme of education may reduce demand per head of population in the longer term.
Source: Christchurch City Council