
This page is not a current Christchurch City Council document. Please read our disclaimer.

Over the last year crime within the City has received considerable media attention and been a source of intense public interest and concern. There has been considerable public discussion both locally and throughout New Zealand about the factors which contribute to crime and strategies for reducing the crime rate. For these reasons the section on crime has been extended to included a more detailed analysis of official statistics than in previous monitoring reports. It highlights the number and type of offences which have occurred in the City over recent years and provides a comparison of offending rates[16].
Total Crime
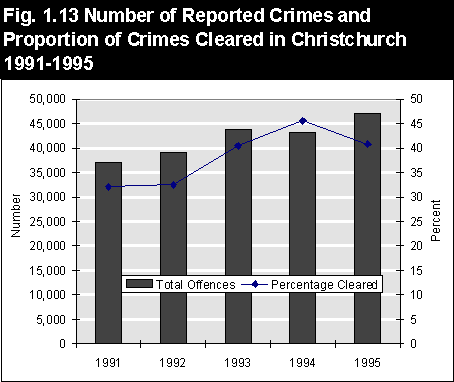
The number of non traffic crimes reported to Police in the Christchurch Police District increased steadily between 1991 and 1995 from 36,983 to 47,048, except for a slight drop in 1994 (Figure1.13). Overall the number of crimes grew by 10,065 reported cases or 27.2 percent, while nationally reported crime grew by only 4.5 percent during the same period ( 21,852).
Christchurch Police District, year to 31 December
Source: New Zealand Police and Statistics New Zealand
Between 1994 and 1995, the number of reported crimes increased by 3,839 or 9 percent. This was largely due to a sizeable increase in dishonesty crimes during 1995 (Table 1.7).
In 1995, Christchurch had the highest rate of offending per 1,000 people[17] in the South Island, but its rate was considerably lower than a number of North Island areas including Auckland, Napier and Hamilton (Table 1.6).
Nationally the clearance rate[18] for all offences in 1995 was 42 percent. At the same time 41 percent of offences in Christchurch were cleared, an increase of nearly 9 percent since 1991 (Table1.7)
Type of Crime
The New Zealand Police have divided offence statistics into seven main groups: violence, sexual, drugs/anti-social, dishonesty, property damage, property abuses and administrative[19]. A breakdown of the number of offences falling into these groups, reported in Christchurch, since 1991 is shown in Table 1.7. The number of offences in each group for Police Districts throughout New Zealand in 1995 is shown in Appendix 2.
Violent Offences
Violent crime is a matter of particular concern to the public. Although making up just nine percent of all offences nationally, it tends to receive considerable attention in the media and arouses more public anxiety than other types of crime[20].
| Table 1.6 Total Reported Offences and Offence Rates per 1,000 Population by NZ Police District | ||
Police District |
Total Offences 1995 |
Offences per 1,000 Population |
| Auckland City | 65,061 |
206.0 |
| Napier | 11,178 |
194.7 |
| Hamilton | 27,207 |
193.4 |
| Wanganui | 13,709 |
174.9 |
| Rotorua | 11,735 |
173.6 |
| Hastings | 12,235 |
166.9 |
| Christchurch | 47,048 |
158.6 |
| Tokoroa | 8,657 |
158.0 |
| Wellington | 21,954 |
156.4 |
| Gisborne | 8,101 |
148.6 |
| Manukau | 30,512 |
147.8 |
| Palmerston North | 23,811 |
145.4 |
| Southland | 13,918 |
140.3 |
| Tauranga | 20,814 |
137.3 |
| Hutt | 22,609 |
131.1 |
| Papakura | 17,617 |
128.3 |
| Dunedin | 15,488 |
127.9 |
| Otago | 8,358 |
127.2 |
| Northland | 16,253 |
123.6 |
| Taranaki | 13,236 |
123.6 |
| Kapiti-Mana | 11,107 |
120.5 |
| West Coast | 3,819 |
119.7 |
| South Canterbury | 6,365 |
117.2 |
| Te Awamutu | 15,274 |
112.7 |
| Nelson | 12,936 |
110.7 |
| Waitakere | 18,122 |
110.2 |
| North Shore | 21,478 |
100.6 |
| Canterbury Rural | 7,650 |
73.1 |
| Auckland Services | 116 |
- |
| Total New Zealand' | 506,368 |
142.7 |
| Source: New Zealand Police and Statistics New Zealand | ||
Violent offences include homicide, grievous, serious and minor assaults, robbery, kidnapping/abduction, intimidation/threats and group assemblies. Although the number of reported violent crimes in Christchurch declined slightly between 1994 and 1995, this type of crime has more than doubled since 1991. Violent crimes increased nationally by 59 percent during this period. The increase in reported assaults by males on females over the past decade has contributed to this dramatic rise. This increase may be a result of growing community intolerance of domestic violence and changing Police practices when dealing with this type of crime.
According to the latest Police statistics, Auckland City had the highest number of reported violent offences in 1995 with 5,718 or 12.6 percent of the nation’s reported violent crime. This was followed by Christchurch with 3,792 (8.3 percent of crime nationally) and Manukau with 3,307 (7.3 percent of crime nationally) reported violent offences (Appendix 2). However the rate of violent offending per 1,000 residents in Christchurch (12.8 per 1,000) was noticeably less than many other districts. Auckland City experienced the highest rate of offending in 1995 with 18.1 violent crimes per 1,000 followed by Manukau with 16 and Wanganui with 15.5 violent crimes per 1,000 residents.
| Table 1.7 Number of Reported Crimes by Year | |||||
| Type of crime | 1991 |
1992 |
1993 |
1994 |
1995 |
| Violence | 1,763 |
2,310 |
3,294 |
3,960 |
3,792 |
| Sexual | 291 |
357 |
459 |
433 |
398 |
| Drugs/Anti-social | 2244 |
2238 |
3504 |
4298 |
3,209 |
| Dishonesty | 29218 |
30140 |
30271 |
28269 |
33,143 |
| Property Damage | 1982 |
2267 |
3225 |
3392 |
3,665 |
| Property Abuses | 1061 |
1422 |
2623 |
2225 |
2,185 |
| Administrative | 424 |
366 |
509 |
632 |
656 |
| Total | 36,983 |
39,100 |
43,885 |
43,209 |
47,048 |
| Percentage Cleared | 32.1 |
32.5 |
40.5 |
45.6 |
40.8 |
Sexual Offences
Sexual offences are those relating to sexual attacks, abnormal or immoral behaviour and indecent videos. Police statistics show that nationally the number of reported sexual offences has increased significantly over recent decades. This increase may not necessarily be due to an increase in sexual offending rather it may reflect a growing willingness amongst victims to report these crimes, as social attitudes change towards issues such as rape and incest. It may also be partially due to initiatives by Police and welfare agencies to uncover sexual offending and the consequent inclusion of sexual offences which may have taken place long before the year in which they are actually reported[21].
Although reported sexual offences in Christchurch have increased overall since 1991, figures for 1994 and 1995 show a slight departure from this long term trend with absolute numbers actually declining. This also reflects the slight drop nationally in sex offences since 1994.
Throughout New Zealand, sexual offending comprised around one percent of total offending in 1995. Similarly around one percent of crime in Christchurch were sexual offences. Not surprisingly the three most highly populated Police Districts, Auckland City (510 offences), Christchurch (398 offences) and Manukau (249 offences) had the largest number of reported sexual offences in 1995 (Appendix 2).
Nationally, 1.2 sex offences were reported per 1,000 population in 1995. The rate of sexual offending was highest in Taranaki (1.69 per 1000), Hamilton (1.65 per 1000) and Auckland City (1.61 per 1000). Christchurch meanwhile, had a lower rate of 1.34 per 1000 residents.
Drug and Anti-social Crime/Offences
The drug and anti-social crime group includes six offence categories: those associated with drugs, gaming, disorder, vagrancy, the sale of Liquor Act and family offences[22]. These types of offences made up the fourth largest crime group in Christchurch in 1995 comprising nearly seven percent of reported offences. Drug and anti social offending accounted for just over 11 percent of offending throughout New Zealand at the same time. In line with national trends, this type of offending in Christchurch declined slightly during the last year.
Christchurch recorded the third highest number of drug and anti-social crime in 1995 (3,209) behind Auckland (8,775 offences) and Hamilton (3,412 offences). However, the City’s drug and anti social offending rate at 11 per 1,000 people was well below almost all other Police Districts in the country. Across New Zealand, there were 16 offences per 1,000 population. While Auckland, Hamilton and Otago recorded the highest rates of 27.7, 24.5 and 23.5 offences per 1,000 people respectively.
Dishonesty Offences
The number of dishonesty offences, including burglary, vehicle theft and interference, theft, receiving stolen items and fraud, reported in Christchurch, increased by 4,874 reported offences (17.2 percent) in 1995 after a brief departure from the longer term trend of growth in 1994. Overall, dishonesty offences made up the majority of all reported crime in the City accounting for 70 percent of offences in 1995 (Table 1.7). Nationally, dishonesty offences constituted 62 percent of all reported offences.
With a rate of 112 per 1,000 people, Christchurch had the fourth highest rate of dishonesty offending in the country in 1995, behind Auckland City (134 per 1,000), Hamilton (125 per 1,000) and Napier (122 per 1,000). The City’s dishonesty offending rate was also noticeably higher than the national figure of 89 per 1000 population.
Property Abuse and Property Damage Offences
Property damage offences include destruction of property and endangering life. While property abuse is a different crime group and includes offences relating to trespass, littering, neglect and cruelty to animals, postal/rail/fire service abuses and Arms Acts offences. Although the number of crimes in both these groups declined in 1994, there has been a general upward trend.
Property damage comprised nearly 8 percent of total crime in the City last year and 8.6 percent nationally while property abuse made up 4.6 percent locally and 5.7 percent of total crime nationally.
Compared to the other Police Districts, Christchurch had the highest number of property damage offences and the second highest number of property abuses reported in 1995. However the rate of offending per 1,000 in both groups was well below many other Police Districts. The rate of property damage offending was 12.4 per 1,000 locally and nationally. While there were 7.4 property abuse offences for every 1,000 people in Christchurch and 8.4 in New Zealand in 1995.
Administrative Offences
Administrative offences range from those against judicial office (such as bribing a member of the Police), to breaches of miscellaneous statutes. Although this is the smallest crime group accounting for less than two
percent of all crime both locally and nationally it has increased steadily in recent years (Table 1.7).
Christchurch, with 656 offences, had the third highest number of reported administrative crimes in 1995, while there were 843 reported offences in Hutt and 694 in Auckland City.
The offending rate for administrative crime in Christchurch (2.2 per 1,000) was slightly below the national figure of 2.5 per 1,000. The highest rates recorded were in Napier (5.4), and Hutt (4.9).