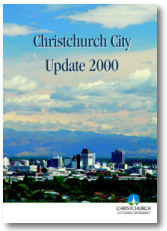
Christchurch’s
latest vital statistics reflect the major changes occurring in the City because of
population growth, new social patterns and environmental factors.
 The City’s
diverse features are described in the City Council’s fifth monitoring report Christchurch City Update 2000. It presents a
detailed picture of Christchurch’s people, environment and economy at the end of the
twentieth century. We learn that although about 30,000 extra people will live in
Christchurch by 2021, the City’s recent growth spurt will slow progressively over the
next two decades. A major trend is the ageing population, which will have a major impact
on our health and social services when the first “baby boomers” approach
retirement near the end of this decade.
Some other interesting facts:
- The size of City households has
decreased, shrinking from 3.1 people in 1976 to 2.6 in 1996.
- The once typical family comprising two
parents with at least one dependent child fell from 49.4 per cent in 1986 to 42.2 per cent
in 1996 while one-parent families increased from 15.3 per cent to 18 per cent.
- In the workforce, growth of part-time
employment is a major trend, accounting for 22.7 per cent of the labour force by 1996.
- At the same time 73 per cent of all
Christchurch residents aged 15 and over indicated they had earned $30,000 or less.
- The City’s urban area increased by
771 hectares or 5 per cent between 1995 and 1999.
- Changing lifestyles have made unit and
apartment living more attractive. The trend of building large homes on small sections has
changed streetscapes.
- Sixteen months of drier than average
weather up to June 1999 had an extensive impact on the regional economy. It also pushed up
the rate of groundwater abstraction.
- The equivalent of almost one month a
year is hazardous to people’s health because of suspended particulate matter
(smog).
- The proportion of households which had
two or more cars increased from 37 to 44 per cent between 1986 and 1999.
- Total waste to the Burwood Landfill has
been declining at a rate of 3,200 tonnes per year since 1994.
- Year-on-year economic growth in
Canterbury for September 1999 was 4.2 per cent – the highest annual growth recorded
since the mid-1990s.
The report, written by Corinne
Macintyre and David Price of the Council’s Environmental Policy and Planning Unit,
tells us that most Christchurch residents think our City is a great place to live. Despite
this, significant pressures including those caused by increasing population, fluctuating
economic conditions, pollution and weather patterns, may adversely affect the environment
and quality of life in the City.
Update 2000 is available both in hard
copy from the Christchurch City Council and on the Council’s web site at www.ccc.govt.nz/Update. It can also be viewed at
a Council library or service centre.
The Council has also produced Christchurch City Fact Pack 2000 providing a snapshot
of the City. It aims to answer commonly asked questions about Christchurch and includes
information on the City’s history, population, natural and physical environment and
aspects of its economy. It can also be accessed on the Council’s web site.